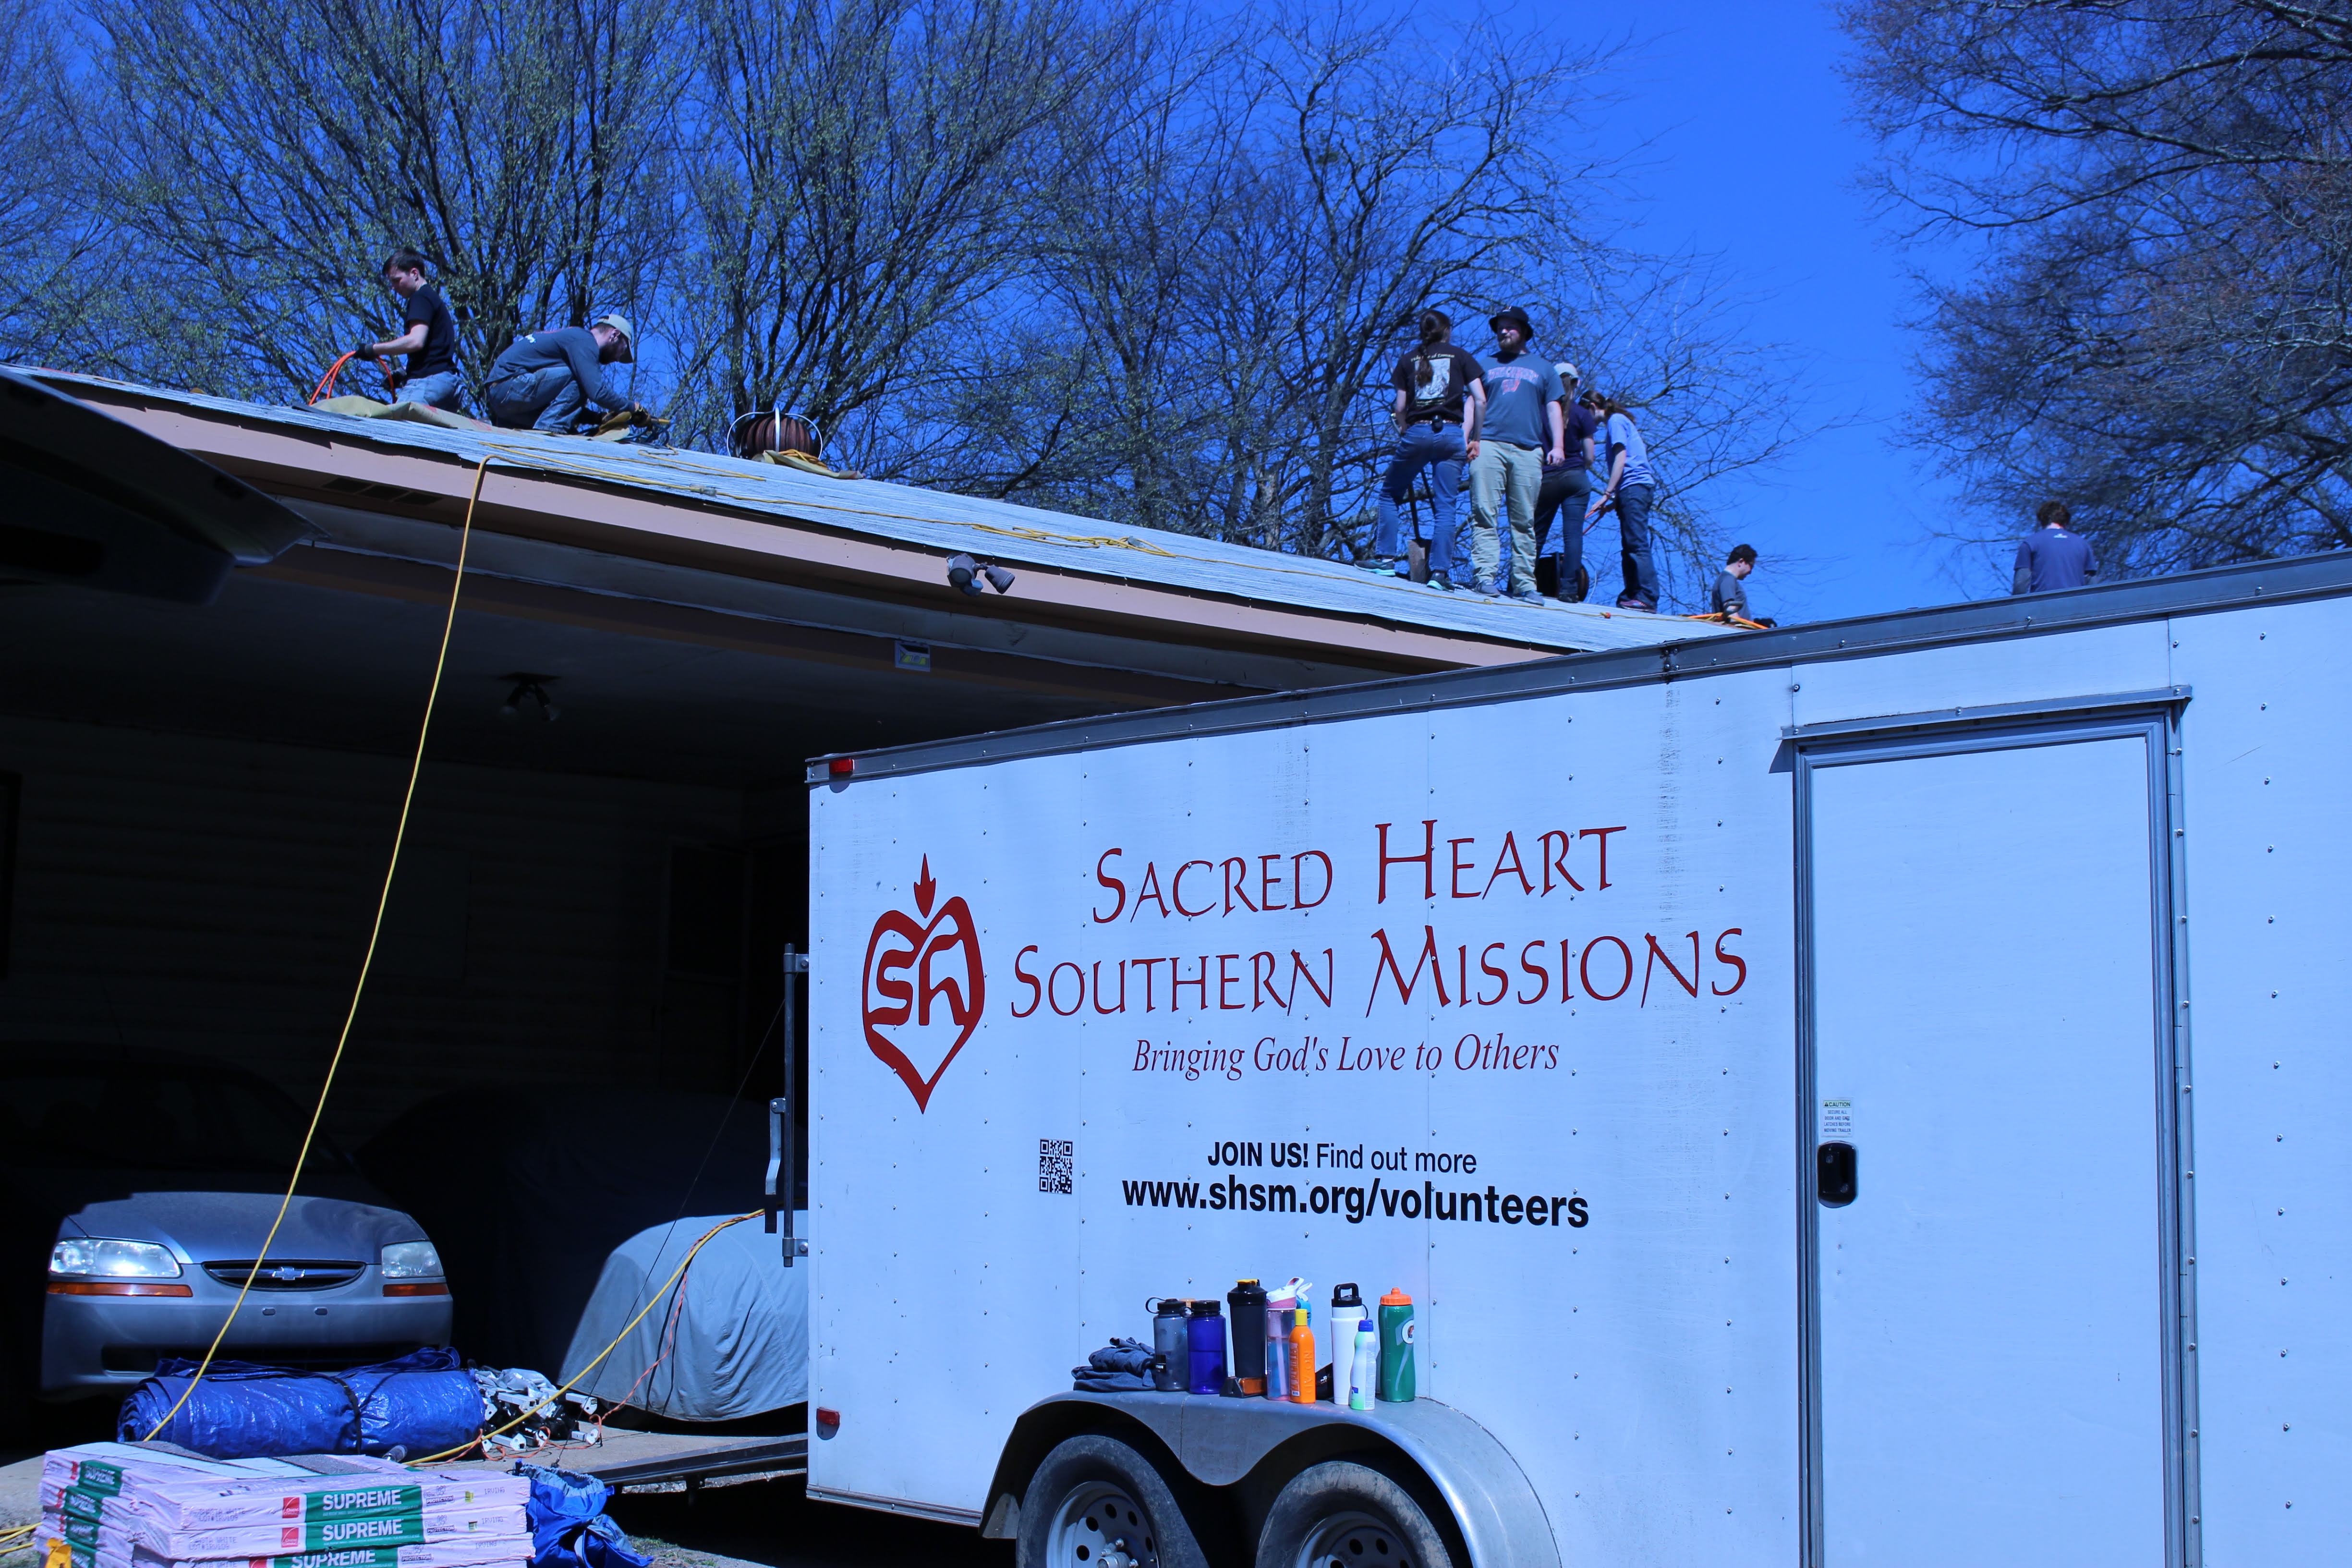
It’s crazy to think that 2 weeks ago I went to Holly Springs, Mississippi for Spring Break to serve the community of the South. I went with the Saint Augustine Newman Center and partnered with Sacred Heart Southern Missions to do volunteer work. During that week, 15 students, 3 FOCUS missionaries, and 3 campus ministries split off to go work at 2 different houses. I went to Ron’s house to tear down his roof that would leak when it rained and rebuild his roof so he no longer has to worry about his roof leaking. My time in Mississippi was an unforgettable experience that I will hold close to my heart because it was a very eye opening. The South has such a rich culture of diversity, the way people interact with each other, the religions, the history that has left scares in the communities, and the ancestors that have told the painful stories to their children, and pasted it down to the next generations. When the Civil War ended and the Civil Rights Movement came to pass, African Americans experienced intense discrimination and shortly, white people were lynching colored people. Most of the stories are disturbing but need to be told in order for political agendas to have a clear understanding of what life was like for African Americans after slavery and ensure lynching never gets repeated. Too often there is a purposeful ignorance that contempt those of color and African Americans faced daily: a life without justice and a life without safety.
In Progress … 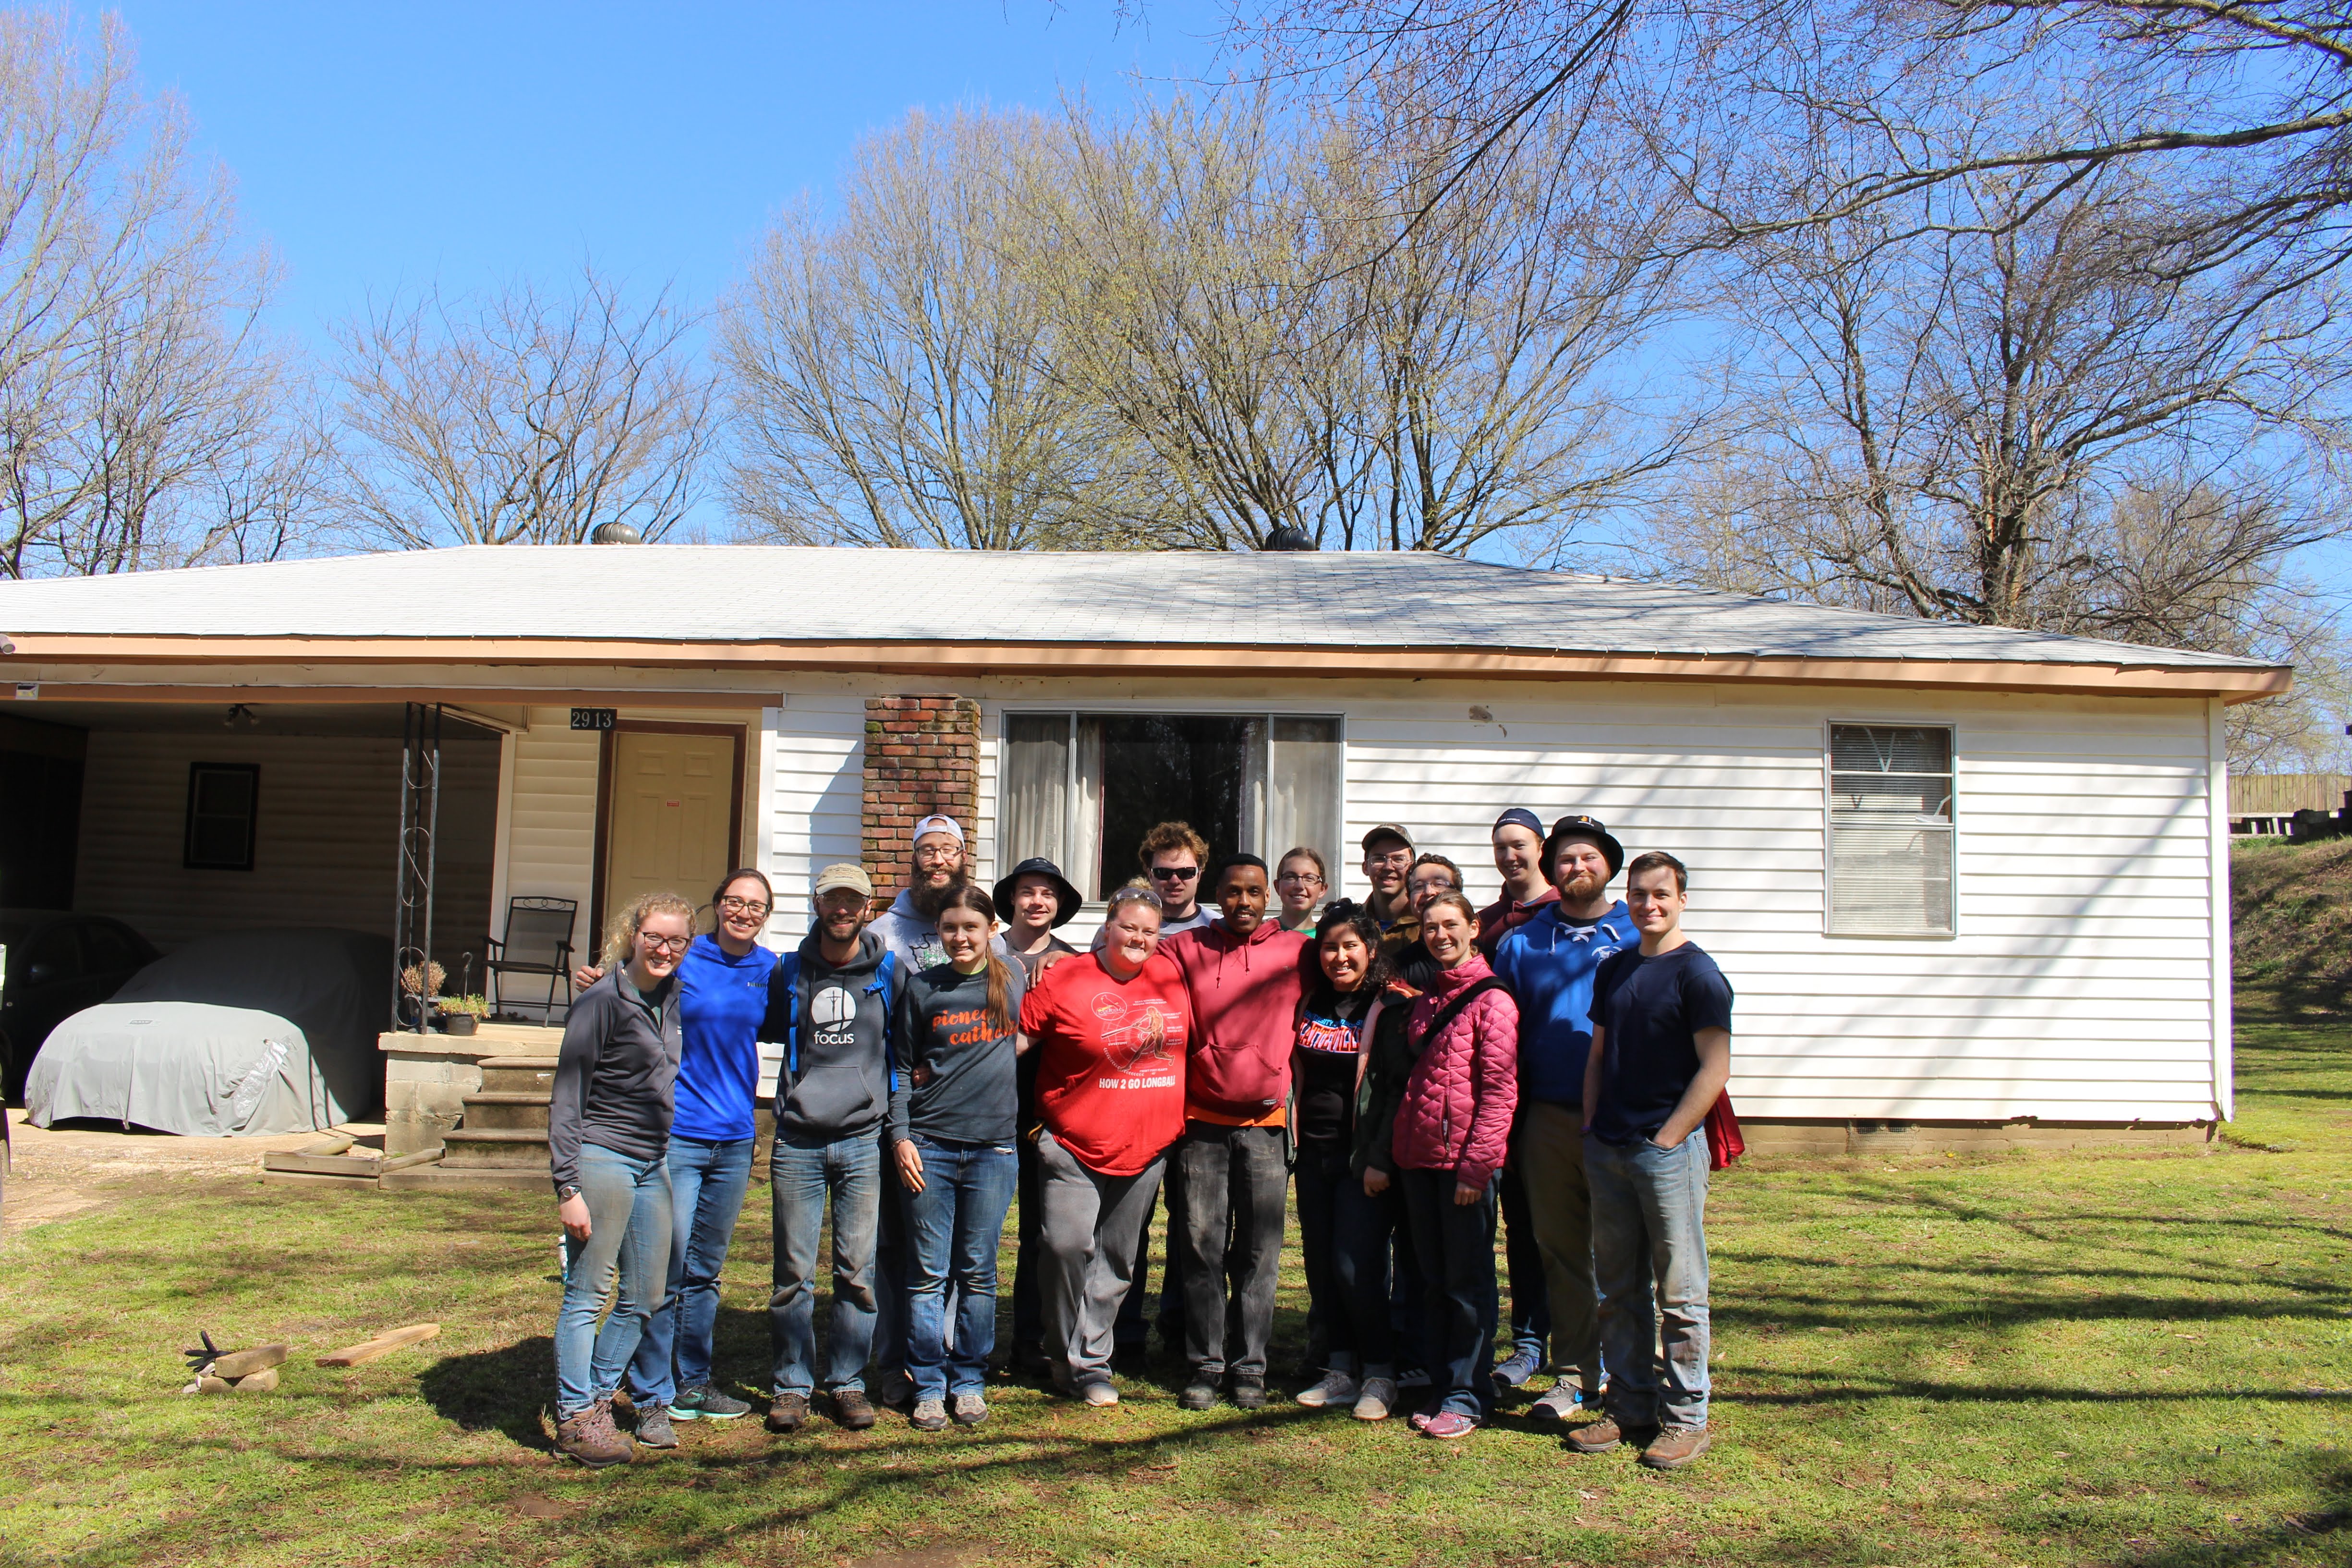
The Final Outcome
Many of you are wondering what an Infographic is by the title of my blog! Well let me tell you… An infographic is condensing complex information into a simple and concise way. For instance, a student would much rather see an infographic about WW2 than read about it in a textbook. They are graphic visual representations of information, data, knowledge intended to present information quickly and clearly by utilizing graphics to enhance the human visual system’s ability to see patterns and trends. Infographics are a great way to teach in a different style by emphasizing on students who learn better visually, they will benefit from this. In fact, the brain processes visual content 60,000 times faster than with text. Don’t get me wrong, reading is a great to get the brain working and improve students reading skills but this gives students the opportunity to learn material in a different way and expand the teacher’s knowledge on different ways to teach to their students. This is because not all 20 students a teacher has in a classroom will have the same talents, gifts, and learning styles.

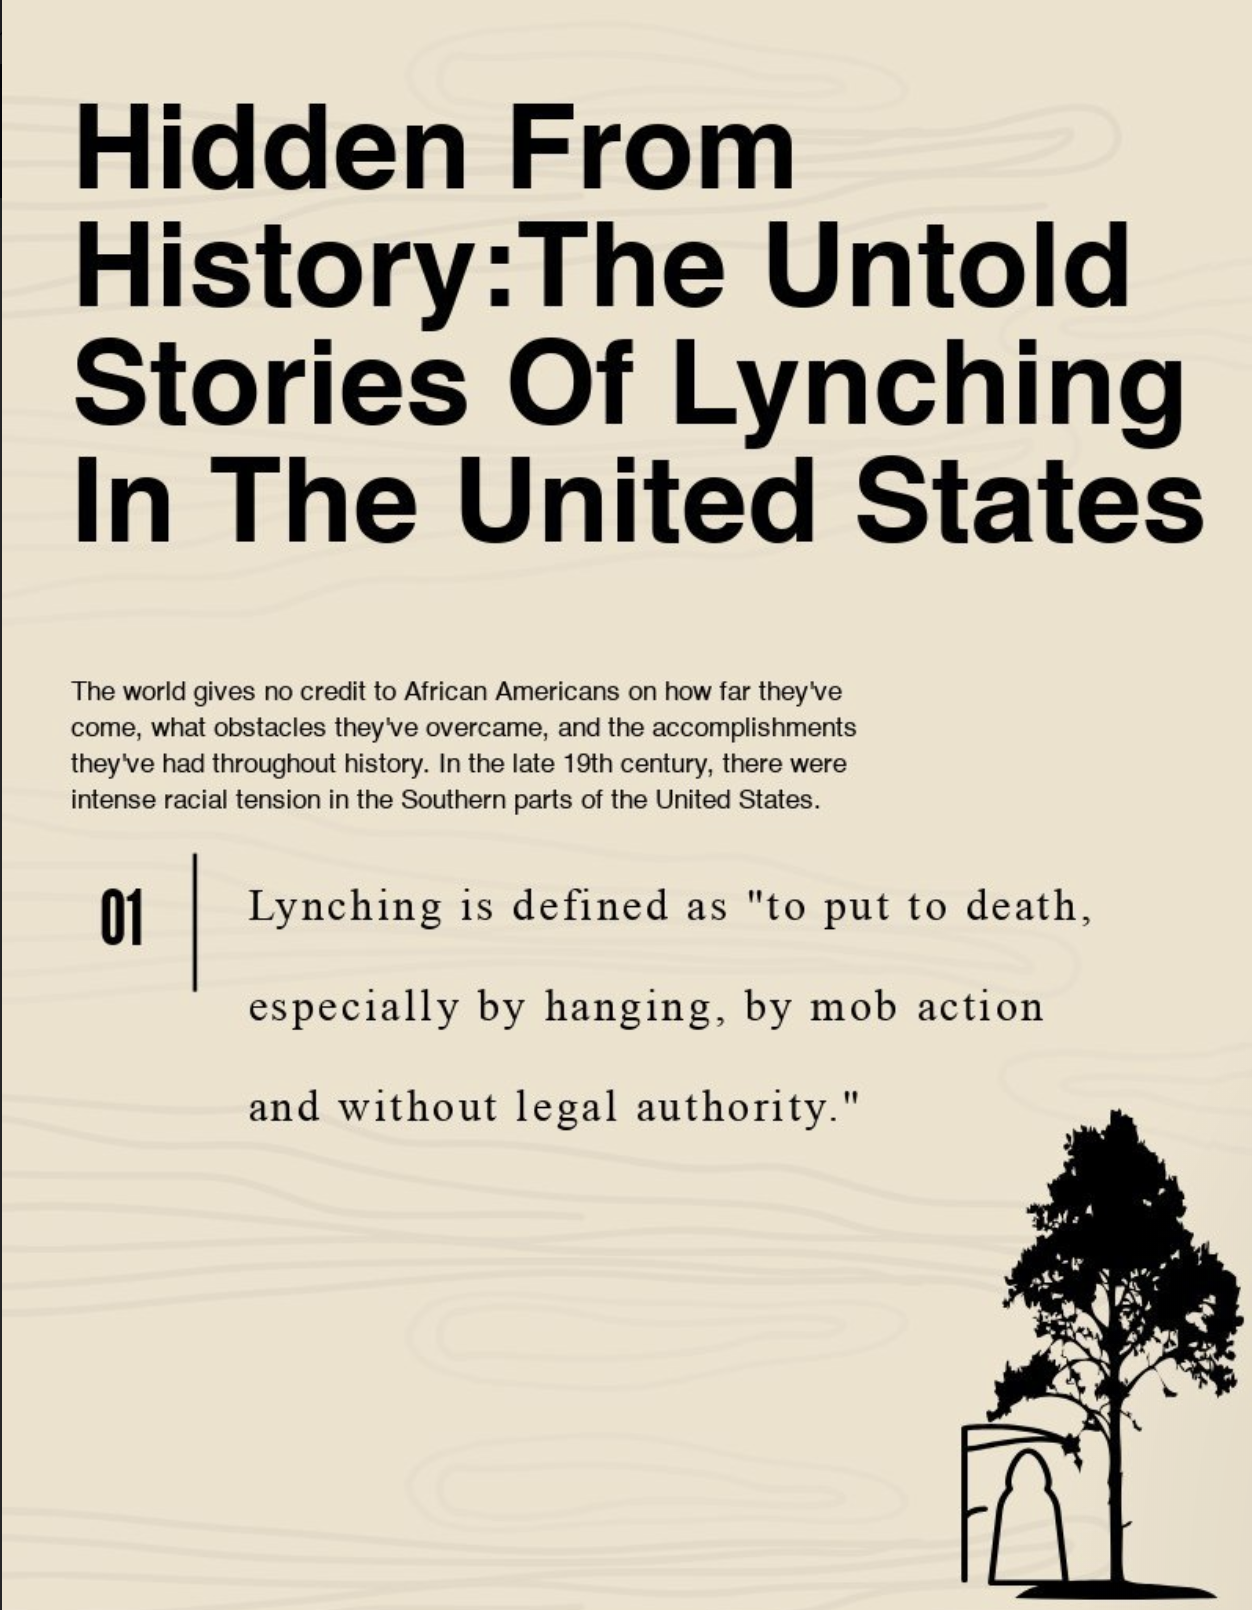
This entails me to telling you about my infographic I did, and that is the history of lynchings in the United States. I decided to pick this topic because I was in Mississippi and it got me thinking of the lynchings that occurred in the South. It was brought to my attention that there is still segregation happening in Mississippi and it made me reflect on the history that took place in the South with the intense racism and in fact, Mississippi had the highest lynchings. For this purpose, I chose to educate people on the untold Stories of lynching that took place in the United States because so often they are hidden from history and are not discussed frequently in schools or illustrated in history textbooks stating the extreme violence of racialism in the Southern parts of the United States. Below is the link to my infographic:
https://create.piktochart.com/output/37820008-untitled-infographic
In the future, I will use infographics in my classroom when I teach a lesson about science because science is complex and usually students understand science better when pictures and videos are presented to them. Therefore, since I don’t want my students getting bored when I am teaching a lesson about how science is implied in our daily lives and it’s everywhere, I would make an infographic and add graphs, pictures, and videos to enlighten my students and make sure I capture the importance of why science matters. Another subject that I would use infographics is social studies because as many times as I hear my little brother tell me social studies sucks due to the fact that his teacher teaches from the textbook only, she starts loosing many kids and they loosing the importance of why social studies matters, and why they need to learn it. Textbooks are needed in a classroom but making kids read an entire section about the medieval times is not going to be very beneficial. This is where I would create an infographic by putting the important aspects of what were the significants about medieval times and put a short clip of that time period. For example, I would add graphics such as a graph of how long that period lasted and images about important people during that time. It’s super important to inform students what’s the purpose and importance of learning the lesson that a teacher is teaching in a classroom. It’s time to make kids love learning again!
